Daily BTC, ETH and SOL analysis
A compact but complete view of the three key instruments, without scattered opinions.
BTC / ETH / SOL · daily market map
Key levels, scenarios, risk and daily logic in one focused market map. BTC, ETH and SOL are read through gamma regime, options levels and nearby expirations, so you can see where price may stabilize, where acceleration is likely and which zones actually shape the session.
Forecasts are published every day after 08:00 GMT.
What it is
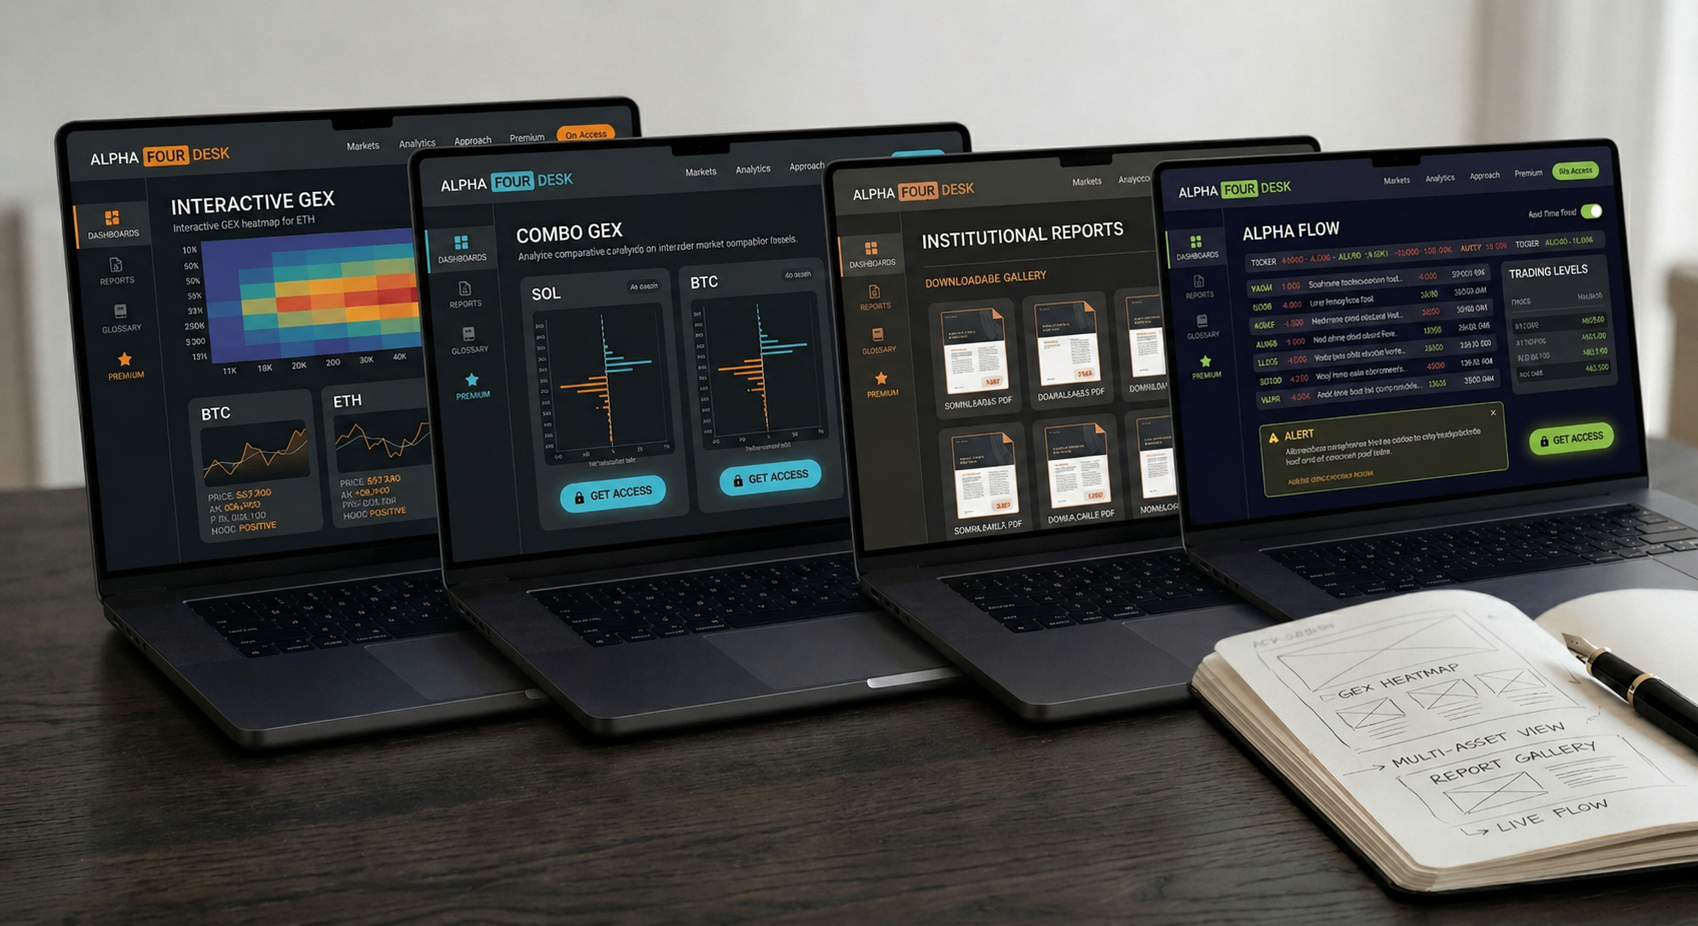
Alpha Four Desk is daily crypto-market analysis for traders who need a calm, structured view of BTC, ETH and SOL. Forecasts are published every day after 08:00 GMT. Instead of a stream of opinions, you get a scenario map of the day: key levels, the working scenario zone and the conditions under which it keeps or loses force.
The result is not a vague prediction, but a structured read of the daily regime and key levels: where the scenario still holds, where a fight is likely and where the structure calls for revision.
Who it is for
Intraday traders who need a clear map of the day without extra noise.
Position traders who want scenarios instead of reacting to every candle.
Private investors and teams who care about levels, context and where the scenario breaks.
Inside
Not just another market overview, but a scenario map of the day: key levels, the working scenario zone, risk and the point where the structure breaks.
A compact but complete view of the three key instruments, without scattered opinions.
Attraction, rejection and scenario-break zones that are relevant for the current session.
A map of possible outcomes: base case, alternative case and transition conditions.
You see where the scenario is still valid and where it should no longer be defended.
We show not only the levels, but why those zones matter for the day.
At the end of the day, the plan is compared with what the market actually did.
Difference
Alpha Four Desk does not try to outshout the market. The analysis is built so a trader can immediately see the structure of the day: where pressure sits, which levels truly matter, what the base scenario is and at what point it should no longer be defended.
Instead of a stream of noisy opinions, you get a scenario map where every observation is tied to regime, level and scenario. That removes unnecessary noise and lets you read the market through clear logic rather than random emotion inside a candle.
This approach is useful not only for entry, but for discipline through the whole session. It shows in advance where price may slow down, where movement can accelerate and where the idea loses force and needs to be revised.
Every conclusion is tied to market regime, level and price logic rather than a random intraday impulse.
The report keeps only what helps today: context, key zones, scenario, risk and the point where the scenario loses validity.
First we map the most likely paths, then define confirmation conditions and the scenario break point. That makes discipline easier to keep.
Method
Options structure helps reveal the zones where price most often changes behavior. These are not random lines on a chart, but key levels where dealer hedging and the concentration of options exposure begin to have a visible effect on the move.
Some levels act as a magnet and a price stabilizer. Others act as a barrier whose break can sharply accelerate the move. That is why on some days the market tends toward range and mean reversion, while on others it shifts toward impulse and level breaks.
For a trader this matters because such zones help you understand in advance where price may slow down, where a fight is likely and where the scenario stops working. It lets you look at the market not as chaos, but as a structure with regime, levels, scenarios and clear risk points.
This is the basis of the daily BTC, ETH and SOL scenario map. First the market regime is defined, then key levels are marked, after that the base and alternative scenarios are built, risk is set and the scenario break point is specified.
First we define whether the market is more likely to stabilize or to accelerate.
Then we mark the zones where price most often slows down, holds or breaks the scenario.
After that we build both the base and the alternative plan for price movement.
At the end we define the point after which the scenario is no longer valid.
Sample card
Demo data shows the report structure. Real values are updated in the daily analysis.
 BTC
BTC ETH
ETH SOL
SOLForecast vs Fact
Every evening we compare the morning scenario with what the market actually did. No retouching: a partial hit is a partial hit.
BTCHold 74,500–75,000 and return to 75,554
ETHHold 2,275–2,300 and return to 2,345
SOLLocal return to 85.0–86.0
Best read of the day — SOL. Working idea on BTC. Weaker execution on ETH.
Evening forecast vs fact breakdown is included in the Premium subscription.
How to read
The forecast is not a “buy or sell” command. It shows where the scenario is alive, where it confirms, where a trade may appear and where the idea breaks.
First we read market behavior, not a ready-made trading command.
Each level is read by function: base, magnet, barrier, pinning zone or risk zone.
Touching a level is not reclaim. Holding and the first normal pullback matter.
Long from base, long by confirmation, short from barrier or short by breakdown.
Positive gamma is not an automatic long, and a level above price does not become a target by itself.
Short rules for where a scenario is alive, where it strengthens, where it breaks and where waiting is cleaner.
Pricing
Basic is a strong entry point for the daily market picture. Premium is the main format for deeper logic, risk, alternative scenario and forecast-versus-fact review. Forecasts are published every day after 08:00 GMT.
Basic
A concise daily report for independent work: key levels, base scenario and scenario break point.
Premium
The main Alpha Four Desk product: deeper scenario work for each instrument with logic, risk and plan revision conditions.
Access is requested through the Telegram bot @A4DeskAccessBot: choose a plan and the bot will open the request. For manual contact, write to @A4Desk. Forecasts are published every day after 08:00 GMT.
FAQ
No. This is scenario-based analysis: levels, probabilities, context, risk and scenario break. The user always makes the final decision.
For intraday and position traders who need a calm daily map for BTC, ETH and SOL.
We use options, futures and spot data for BTC, ETH and SOL from several sources: Deribit, OKX, Bybit, Binance, Laevitas and Amberdata.
The data is aggregated and cross-checked so the map does not depend on one venue and can show a more stable view of options structure, liquidity and key levels.
Because the daily map is built where there is a real liquid market, not just price movement on a chart.
BTC, ETH and SOL have enough depth in options and derivatives to read levels, risk zones and larger participant behavior. We do not spread attention across dozens of coins: a focused map for three strong instruments is more useful than a noisy picture of the whole market.
Choose Basic or Premium and press "Request in Telegram". The bot @A4DeskAccessBot will open and accept the request.
The forecast and market map are published every day after 08:00 GMT.
No. The material is analytical and informational, not individual investment advice.